Workspace ribbon
Purpose
The Workspace ribbon contains useful tools and windows that are essential to helping you get the most out of using NeuroInfo. They include windows that help with navigation, panels that assist with viewing and analyzing images, and tools for general analysis.
Workspace groups
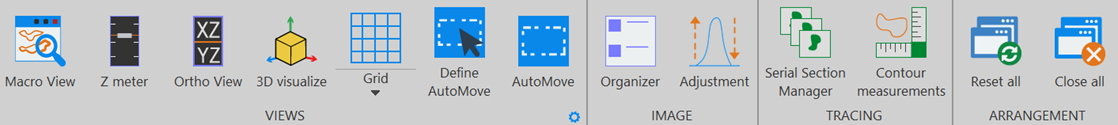
Views
|
|
|

|
Use the Z meter to view the cursor location in the Z axis; it is helpful as you navigate or trace. See Z meter for more information. |

|
|

|
View your image or image stack |

|
Click to display a grid in the main window. Displaying the grid may be useful for visually dividing a region into fixed areas for further analysis. For more instructions, see Grid. |

|
Define the size of the AutoMove area in the main window. See AutoMove for more instructions. |

|
AutoMove is an automatic centering procedure. It acts in conjunction with the AutoMove area, represented as a dashed rectangle, to help enable you to trace structures larger than a single field of view. The tracing and the image move together so that there is no loss in registration. See AutoMove for more information. |

Image

|
The Image Organizer displays the location and status of each image that is open in the main window and provides options for manipulating image appearance. For more details, see Image organizer. |

|
The Image Adjustment panel enables you to change how the current image looks on screen. You can save these adjustments with the image if you choose; you'll be prompted to decide when you close the file or exit the software. See Image adjustment for more information. |

|
The Luminance Histogram is a visual representation of luminance data collected from image data contained within a contour. Collect luminance must be activated to see data in the histogram. See Luminance histogram for instructions. |
Tracing

|
Use the Serial Section Manager to define the key parameters (i.e., initial section thickness, Z position, etc.) for each section. For in depth instruction, see Serial section manager. |

|
Contour measurements Analyses of all contours visible in your current tracing. The data are updated in real time as you trace new contours. For more details, see Contour measurements. |
Arrangement

|
Click to reset all docked windows to their default location. |

|
Click to close all dockable windows. |