Publish ribbon
Purpose
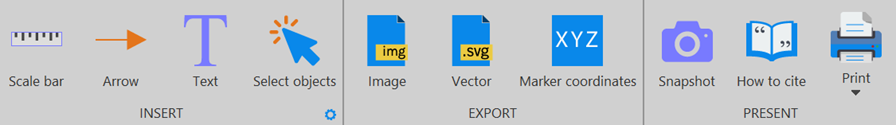
The Publish ribbon contains tools useful for creating figures for presentation or publication.
Publish groups
Insert
|
|
Add a scale bar to your tracing, embed a scale bar in an image, or display a scale bar while using NeuroInfo. For more details, see Scale bar. |
|
|
Place an arrow to point to specific structures. Use in conjunction with Text for more detailed annotations. See Arrow for more information. |

|
Add text to your image, for example to label structures of interest. For more instructions, see Text. |

|
Use to select scale bars, arrows, text or any other objects for editing. For more information, see Select objects. |

Export
|
|
This tool generates a raster image (also known as bitmap) (.tif, or .jp2) and enables you to save images along with tracings. You can choose to include just a portion of the tracing, modify colors, add a scale bar, specify the size of the exported image. See Export tracing in image format (.tif, .jp2) for more information. |

|
Generate an .svg or .emf (Windows Enhanced Metafile) file of your data. See Export tracing as a vector image (.svg, .emf) for more infomation. |

|
Use this command to obtain the location of all markers relative to the reference point (in microns) for use in Excel or MatLab. See Export marker coordinates for more details. |

Present

|
Capture a screen shot of what is currently displayed in the main software window. See Snapshot for more information. |
|
|
Click for detailed information on how to cite MBF Bioscience software products. See Citing MBF Bioscience software in your paper. |
|
|
Choose a print option from the dropdown menu. You can choose between printing the tracing (or tracing and images) that are visible in the main window, or you can print the entire tracing (or tracing and images) including what is not visible in the main window. |

