Image Volume Fractionator workflow >
Available with the Stereo Investigator Cleared Tissue module only. Click here for more information.
8. View the sampling results
Procedure
View the results using one of the following methods:
- Click a set in the Probe Runs list to select it and click the button. The Sampling Results window is displayed.
- Click (use after running more than one probe if you want results from multiple probe runs). The Previous Stereological Runs window is displayed.
From the list, highlight the probe runs of interest.
Click . The Sampling Results window is displayed.
Click on a category in the left hand panel to display the corresponding results in the right hand panel.
By default, the Sampling Results window initially displays the estimated population and marker total for the first marker type in the marker bar used for counting. Click on other marker types in the left hand panel to see the corresponding results in the right hand panel.
Optional: Click to export all results directly to Excel (2003 or later).
To view results for an entire region of interest, Ctrl-click to select all probe runs from the sections containing the region of interest. This will generate results for the entire structure, not just one section of the structure.
Interpretation
Results are generated for each individual marker type used for counting as well as for all markers combined. By default, the Sampling results window initially displays the estimated population and marker total for the first marker type in the marker bar used for counting. Click on other marker types in the left hand panel of the Sampling results window to see the corresponding results in the right hand panel.
Estimated population
The estimated population is calculated based on the total number of markers, the disector height, the counting frame size, the grid size, and the virtual section height. See Image Volume Fractionator equation.
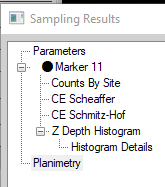
Sampling results window
Displays the results of the probes selected in the Previous Stereological Runs window (see Display Probe Run List). Click on a category in the left hand panel to display the corresponding results in the right hand panel.
-
Parameters: File information and parameters associated with the selected probe runs. Descriptions of parameters are listed in the Right panel parameters drop down.
-
Marker X: Population estimate and total number of markers.
-
Counts by Site: Raw data for each counting site visited in each of the runs.
-
CE Gundersen/CE Scheaffer/CE Cruz-Orive/CE Schmitz-Hof: See Coefficients of Error. Note: CEs will only be calculated if a minimum of three sections have been analyzed.
-
Variance Details: Raw variance data used in the Gundersen CE calculation. See Coefficients of Error.
-
Z Depth Histogram: Z depth location for markers placed in each section.
-
Planimetry: The area within each traced contour and the volume of the region of interest based on the total area of the contours and the virtual section height.
Note that planimetry is biased; for an unbiased estimate of area/volume, use the Cavalieri Estimator.
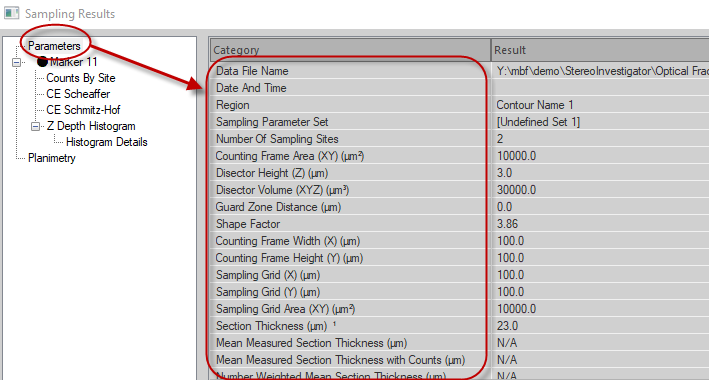
The following results are displayed when Parameters category is selected in the left hand panel of the Sampling Results window:
-
Data File Name: File name associated with this data set, if the data was already saved.
-
Date and Time: When the probe was completed.
-
Region: Name of the contour type that defines the region of interest. If this is a composite of several runs, displays the contour name used for the first run is shown.
-
Number of Sampling Sites: Number of sampling sites visited on all selected sections.
-
Disector Height (Z)(µm): Z-axis height of each disector.
-
Disector Volume (XYZ) (µm³): Area of the disector based on the counting frame dimensions and the disector height.
-
Counting Frame Width (µm): X-axis width of each counting frame.
-
Counting Frame Height (µm): Y-axis height of each counting frame.
-
Counting Frame Area (µm²): Area of a single counting frame.
-
Sampling Grid Width (X)(µm): Distance between counting frames (sampling sites) along the X-axis.
-
Sampling Grid Height (Y)(µm): Distance between counting frames (sampling sites) along the Y-axis.
-
Sampling Grid Area (XY)(µm²): Area of each grid step (Sampling Grid Width x Sampling Grid Height).
-
Virtual Section Thickness (µm): Value used for section thickness across all sections that were sampled.
-
Section Evaluation Interval: The interval of the tissue sections used for counting. Since Image Volume Fractionator uses virtual sections that are stacked directly on top of each other (rather than physically cut sections which can be separated out into interval sets), the section evaluation interval always equals 1. See Image Volume Fractionator equation.
Prints the currently displayed results category for all selected probe runs.
Prints results of all selected probe runs.
Copies the currently displayed results category for all selected probe runs to the Windows Clipboard.
Copies results of all selected probe runs to the Windows Clipboard.
Displays the equations used for the probe runs.
Exports results of all selected probe runs directly to Excel (2003 or later).
Closes the Sampling Results window.
About export to Excel
Click in the Sampling Results window. Results of all selected probe runs are exported directly to Excel (2003 or later). Each category in left hand panel of the Sampling results window is exported to a separate worksheet within a single Excel file.
-
Summary: Population estimates and Coefficients of Error (CE) for each individual marker.
-
Parameters: File information and parameters associated with the selected probe runs. This information should be added to the Methods section of a publication to enable other researchers to test the reproducibility of the results.
-
Counts by Site: Lists the number of markers at each site. This information can be used to calculate your own CE, or to compare number of objects within a section or between sections.
-
Coefficient of Error: Lists all Coefficients of Error. Note: CEs will only be calculated if a minimum of three sections have been analyzed.
-
CE Variance Details: Raw variance data used in the Gundersen CE calculation. See Coefficients of Error.
-
Section Details: Lists marker counts by section.
-
All Markers Z Histogram and Individual Markers Z Histogram: Distribution of marked objects within the tissue.
Note: A spike of cells at the top of the histogram could be caused by counting cell bottoms at the top of the section as though they were cell tops (assuming that cell tops are the unique point you're trying to count).
-
Z Depth: Lists how many markers are contained in Z-depth bins of 1 micron each. These values are used to generate the Z depth histograms.
-
Z Depth Details: Lists the Z values for each marker. These values are used to generate the Z depth histograms.
-
Smoothness : Distribution of markers within your region of interest.
-
Planimetry : Area of each section and volume calculated from this area.
Note that planimetry is biased; for an unbiased estimate of area/volume, use the Cavalieri Estimator.
-
Z Order : Z value of the sections and the actual Z at which the contours were drawn in each section.
-
Raw Report : Number of markers and tissue thickness per site.