Probe run list
Purpose

|
A probe run consists of the group of sites within a single region of interest where data was collected Click Probe Run List to display a list of all the stereological probe runs associated with the current data set and compile data to generate estimates |
Procedure
-
 Click Probe Run List on the Probes ribbon
 -
From the list, highlight the probe runs of interest.
To view results for an entire region of interest, Ctrl-click to select all probe runs from the sections containing the region of interest. This will generate results for the entire structure, not just one section of the structure.
-
Click to open the Sampling Results window.
-
Click on a category in the left hand panel to display the corresponding results in the right hand panel.
- Optional: Click to export the results of all selected probe runs directly to Excel (2003 or later).
Previous Stereological Runs window
Displays a list of all the previous stereological runs associated with the current data set along with the counting parameters. Select probes of interest and click
To view results for an entire region of interest, Ctrl-click to select all probe runs from the sections containing the region of interest. This will generate results for the entire structure, not just one section of the structure.
Restarts the probe (keeps all data associated with the probe). Useful for second reviewers or to resume work for a probe run that couldn't be completed in one session (in this case, the probe is restarted at the site that was visited last).
- If the second run occurs after the synchronization between the tracing and a given section has been lost (e.g., the slide is removed from the microscope), realign the tracing with the slide to review the original run accurately.
- If the markers placed during the first run are turned off, a second run can be executed without the visual bias of previous markers.
Displays results of selected probe runs.
Deletes the selected probe run.
This does not delete the markers associated with the probe run. To delete the markers, select the section in the serial section manager, select the markers that were associated with the probe run and delete them.
Use to view the counting frame locations of the probe run.
Displays the Configure Probe Run List dialog. Use to add, remove, and configure the columns in the Previous Stereological Runs window.
Closes the Previous Stereological Runs window.
Sampling Results window
Displays the results of the probes selected in the Previous Stereological Runs window. Click on a category in the left hand panel to display the corresponding results in the right hand panel.
By default, the Sampling results window initially displays the estimated population and marker total for the first marker type in the marker bar used for counting. Click on other marker types in the left hand panel of the Sampling results window to see the corresponding results in the right hand panel.
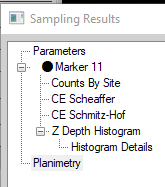
- Parameters: File information and parameters associated with the selected probe runs. Descriptions of parameters are listed in the Right panel parameters drop down.
- Marker X: Population estimate(s) and total number of markers.
- Counts by Site: Raw data for each counting site visited in each of the runs.
- CE Gundersen/CE Scheaffer/CE Cruz-Orive/CE Schmitz-Hof: See Coefficients of Error.Note: CEs will only be calculated if a minimum of three sections have been analyzed.
-
Variance Details: Raw variance data used in the Gundersen CE calculation. See Coefficients of Error.
- Z Depth Histogram: Z depth location for markers placed in each section.
-
Planimetry: The area within each traced contour and the volume of the region of interest based on the total area of the contours and the virtual section height.
Note that planimetry is biased; for an unbiased estimate of area/volume, use the Cavalieri Estimator.
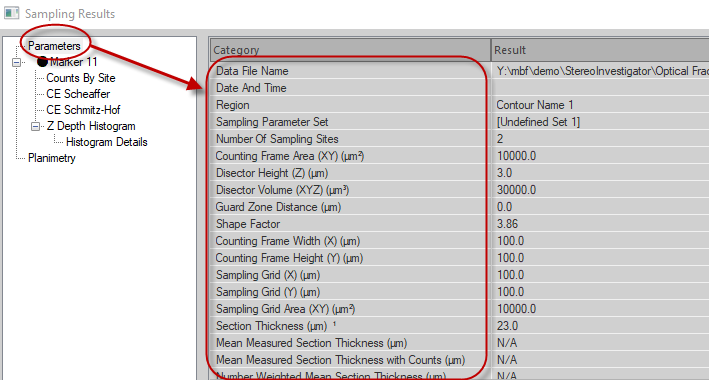
The following results are displayed when the Parameters category is selected in the left hand panel of the Sampling Results window:
- Data File Name: File name associated with the data set, if the data was already saved.
- Date and Time: When the probe was completed.
- Region: Name of the contour type that defines the region of interest. If runs from multiple contour types are selected, the contour name used for the first run is displayed.
- Sampling Parameter Set:Name of the saved sampling parameter set (if one was used).
- Number of Sampling Sites: Number of sampling sites visited on all selected sections.
- Disector Height (Z) (µm): Z-axis height of each disector.
- Disector Volume (XYZ) (µm³): Area of the disector based on the counting frame dimensions and the disector height.
- Guard Zone Distance (µm): Z-axis height of the guard zones.
- Contour Shape Factor:Shape factor provides information about the complexity of a contour and is calculated by dividing the perimeter of a contour by the square root of its area. Perimeter and area can be found in the contour measurement window.
- Counting Frame Width (µm): X-axis width of each counting frame.
- Counting Frame Height (µm): Y-axis height of each counting frame.
- Counting Frame Area (µm²): Area of a single counting frame.
- Sampling Grid (X) (µm): Distance between counting frames (sampling sites) along the X-axis.
- Sampling Grid (Y) (µm): Distance between counting frames (sampling sites) along the Y-axis.
- Sampling Grid Area (XY) (µm²): Area of each grid step (Sampling Grid Width x Sampling Grid Height).
- Section Thickness (µm): Manually entered user-defined value for the post-processed or “mounted” section thickness. If no value is manually entered, this will be 0.00. Note, that obtaining population estimates using a manually entered section thickness in not recommended. We recommend measuring the section thickness at each site during counting.
- Mean Measured Section Thickness (µm): Mean of all section thickness measurements recorded while counting.
- Mean Measured Section Thickness with Counts (µm): Mean of section thickness measurements obtained at each counting site containing marked objects.
- Number Weighted Mean Section Thickness (µm): Weighted mean of the section thickness measurements obtained at each counting site containing marked objects. The measurements are weighted by the number of objects associated with the corresponding site.
- Section Evaluation Interval: The interval of the tissue sections used for counting. For example, if every third tissue section was counted, the Section Evaluation Interval is 3.
Prints the currently displayed results category for all selected probe runs.
Prints results of all selected probe runs.
Copies the currently displayed results category for all selected probe runs to the Windows Clipboard.
Copies results of all selected probe runs to the Windows Clipboard.
Displays the Shape Factor dialog box (see Shape Factor). To obtain as accurate an estimate of the Coefficient of Error as possible, use the slider to edit the Shape Factor which describes the shape of the region of interest.
Use to adjust the mounted section thickness.
Displays the equations used for the probe runs.
Exports results of all selected probe runs directly to Excel (2003 or later).
Closes the Sampling Results window.