Explore Ribbon
Purpose
The Explore ribbon includes a suite of tools for visualizing data using color. You can create heat-map style images of detected/modeled structures in data files that can provide new perspectives on their biological significance.
Procedure
Procedure overview
-
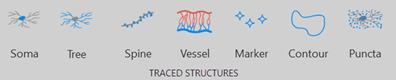
Choose a structure to visualize from the Traced Structures group on the ribbon.
-
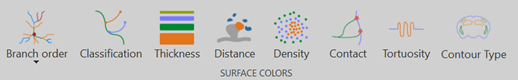
Choose a visualization category from the Surface Color group on the ribbon. Most categories open a window with context dependent settings.
-
Adjust the settings for the color visualization if applicable.
and/or
-
Adjust the Color Gradient slider:
-
Click and drag the circles to adjust the gradient between the main colors.
-
To change the colors, double click on the circles and choose a new color from the color picker window.
-
-
-
 Click Trace Color on the ribbon to turn off visualization colors and return to the colors of the structures when they were originally reconstructed.
Procedure details

|
Displays each branch order as a unique color which makes it useful for viewing branching patterns. |
| Choose a branch order scheme from the dropdown menu. See Branch Order Schemes for definitions of the different branch order types. | |

|
Displays trees or vessels in classification colors if branch segments have been assigned a classification type. |
| Click to display trees or vessels in classification colors. | |

|
Displays the diameter (µm) of trees or vessels as a color gradient, where the thickest point on a tree or vessel is one color and the thinnest point is another color. If structures were traced in 2D, thickness must be applied while creating the data file. You can also visualize the thickness of markers if intrinsic sizing was applied while creating the data file. |
|
Click to open the Color by Thickness window: Color Gradient: Use the slider to adjust the gradient between the two colors and/or choose new colors. |
|

|
Displays the distance (µm) between two structure types as a color gradient, where the furthest structure is one color and the closest structure is another color. |
|
Click to open the Color by Distance window:
|
|
|
|
Displays the density of a structure type as a color gradient, where the densest concentration of the structure population is one color and the sparsest concentration is another color. |
|
|
Click to open the Color by Density window:
|
|
Displays the points of contact between two structure types as a single color. The non-contacting points of the structures are displayed in a contrasting color. |
|
|
|
Click to open the Color by Contact window:
|
|
|
Displays the tortuosity of trees or vessels as a gradient, where the highest tortuosity value is one color and the lowest value is another color. |
|
|
Click to open the Color by Tortuosity window: Color Gradient: Use the slider to adjust the gradient between the two colors and/or choose new colors. |
|
Displays the surface area of trees or vessels as a gradient, where the structure with the highest total surface area is one color and the structure with lowest total surface area is another color. |
|
|
|
Click to open the Color by Surface Area window: Color Gradient: Use the slider to adjust the gradient between the two colors and/or choose new colors. |
|
|
Displays a legend containing the selected contour types and their corresponding colors. The name and color of contour types can be customized while creating the data file. |
|
|
Click to display a color legend for contour types. |


Surface color availability
Surface color options available depending on which traced structures are selected and present in the data file.
|
Available Surface Colors |
Selected Traced Structure | ||||||
| Soma | Tree | Spine | Vessel | Marker | Contour | Puncta | |
| Branch Order | ✓ | ||||||
| Classification | ✓ | ✓ | |||||
| Thickness | ✓ | ✓ | ✓ | ||||
| Distance | ✓ | ✓ | ✓ | ✓ | ✓ | ✓ | |
| Density | ✓ | ✓ | ✓ | ✓ | ✓ | ✓ | |
| Contact | ✓ | ✓ | ✓ | ✓ | |||
| Tortuosity | ✓ | ✓ | |||||
| Surface Area | ✓ | ✓ | |||||
| Contour Type | ✓ | ||||||