Mobility
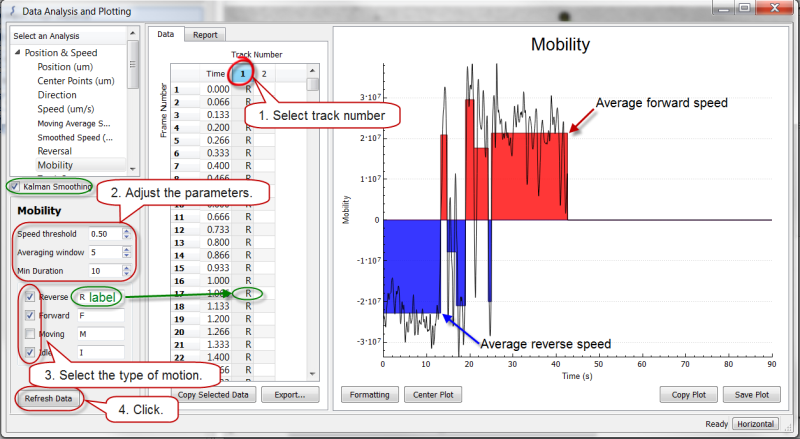
Mobility is similar to Moving Average Speed but provides additional analytical tools (speed threshold and minimum duration) to track motion.
A block of color indicates a series of frames meeting the Mobility criteria. The y-value of a given color block represents the moving average speed for the series of frames.
To use the analysis:
- Click a Track Number column in the Data table to display the corresponding plot.
- Experiment with adjusting Speed threshold, Averaging window, and Minimum duration.
- Select the type of motion you want to track.
- Moving combines Reverse and Forward.
- Optional: label the types of motion; the label appears in the Track Number column.
- Click Refresh Data to apply the adjustments.
|
Possible issue affecting mobility:
|
Possible solution:
|
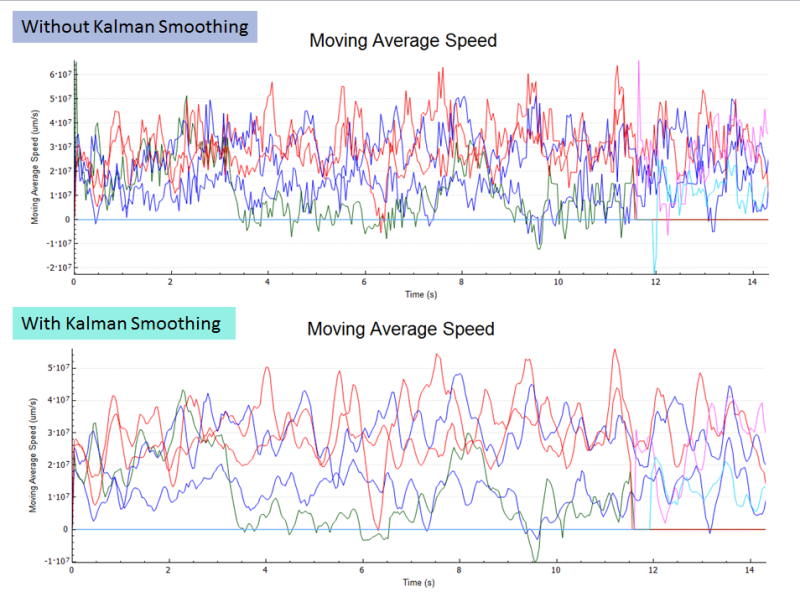
 Midpoint shifts may occur as a result of the model fit, briefly translating as incorrect tail outlines during tracking.
  Kalman