Tangential distribution analysis
Purpose
Tangential Distribution analysis is used to obtain data about length and distribution in virtual/anatomical regions.
How it works
In Neurolucida or Neurolucida 360, draw a closed contour in the XY plane around the neuron you want to analyze. The contour's Z coordinate doesn't matter.
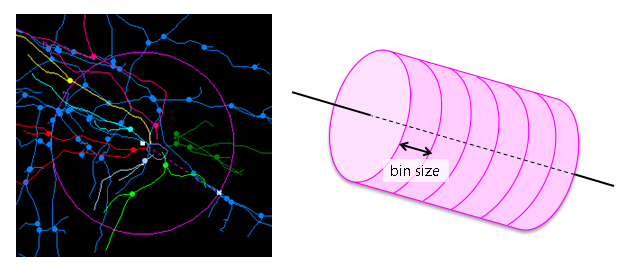 In Neurolucida Explorer, the contour is treated as a 3D volume divided into equal size analysis bins. The volume's depth is infinite in Z. The bins are generated along the long axis of the contour, or along the X or Y axis.
Procedure
-
Select the contour, cell body, and trees.
-
 Select Tangential Distribution analysis from the Anatomical dropdown menu on the Analyze ribbon to open the Tangential Distribution Analysis window.
 -
Select the branched structure type to analyze and click Display to open the Tangential Distribution Information window.
-
In the Tangential Distribution Information window, adjust and select settings as desired:
-
Bin Size: Length of the bin.
-
Bin Orientation:
-
Center First Bin About Soma: If checked, the first bin is centered at the center point of the cell body; if unchecked, the first bin is based on the contour.
-
Automatic Orientation With Contour: The bins are created along the long axis of the closed contour. Width Modifications is enabled.
-
Bins Parallel to X/Y-axis: The bins are arranged along the specified axis.
-
-
Width Modifications: Check Process Multiple Widths and adjust settings.
-
-
Click OK
Analysis results
Start: Beginning of the bin.
End: End of the bin.
Length: Length of the trees within a given bin.
Percent: Percentage of all the trees in a given bin.
Reference
Bender, K. J., Rangel, J., & Feldman, D. E. (2003). Development of Columnar Topography in the Excitatory Layer 4 to Layer 2/3 Projection in Rat Barrel Cortex. The Journal of Neuroscience : The Official Journal of the Society for Neuroscience, 23(25), 8759–8770.