Proximity Analysis
Purpose
Use Proximity analysis to analyze the distance between two trees.
Neurolucida Explorer compares the trees and determines the percentage of the fiber in closest proximity to the neighboring fiber.
Procedure
- Select both trees in the Traced Structures panel by clicking their labels.
-
 Select Proximity Analysis from the Anatomical dropdown menu on the Analyze ribbon to open the Proximity Analysis window.
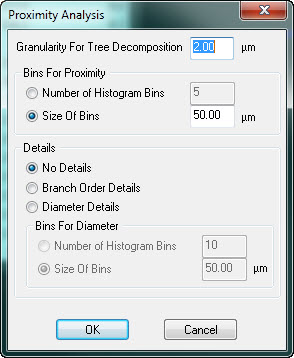
Granularity for Tree Decomposition: Distance between points on each individual fiber.
Ex: Setting the granularity at 2 for a 10 µm fiber results in 5 points on the fiber.
- Bins for Diameter: Available if you selected Diameter Details.
Analysis results
Tree: Neurolucida Explorer assigns number 1 and number 2 to the trees of interest.
Bin Start and Bin End: Shortest distance bin between the points.
Length: Length of the tree within the range of the shortest distances.
Percent Length: Percentage of the tree length that is within the distances specified in Bin Start and Bin End.
Order: If you selected Branch Order Details, values are broken down by order.
Reference
Bearden, S.E., and Segal, S.S. (2005). Neurovascular alignment in adult mouse skeletal muscles. Microcirculation. Mar 12(2):161-1677.