Markers
Purpose
|
Markers analysis provides the quantity, diameter, coordinates, and nearest neighbor distances of selected markers. |
Analysis results
Marker summary: The marker summary report provides a count of the number of markers.
- Markers are grouped according to their type.
- Each marker symbol is identified
as a numeric type and a name.
- The numeric typing of markers is done uniformly throughout all of the reports available in the marker and region analysis.
- The type can be used in spreadsheets to identify markers of the same type.
- Quantity is the number of markers.
- The average diameter is computed as the mean of all markers in each row.
Marker details: The marker details report provides the location and diameter of markers.
- Markers are grouped according to type.
- Marker symbols are identified by numeric type and name.
- Coordinates (x, y, z) are the location of the marker.
- Diameter: marker diameter; this can be specified by selecting Markers from Preferences in the File menu.
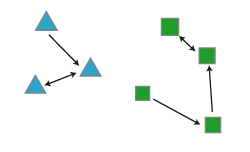
Markers - Nearest neighbor: Measures the distance between the closest pair of markers. Nearest neighbor analysis is useful in understanding the distribution of markers in a population.
The nearest neighbor calculations are done only within a population of markers of the same type.
- The same numeric type and symbol columns as used in the Marker Summary report begin each row in the nearest neighbor analysis.
- There is a row in the report for each separate population of markers used in the analysis.
- The columns containing distances describe the distribution of markers. The distance is computed from each marker in the population to the nearest marker of the same type.
- The nearest neighbor values for all markers are averaged and reported along with the smallest and largest nearest neighbor values.
If cell A is closest to cell B, it may not be true that the closest cell to cell B is cell A. The two furthest markers are a distance apart known as the diameter of the population.
Markers - Nearest neighbor details: Generates a complete list of the nearest neighbor values.
- The report is written directly to a file since the final report is as long as the number of markers selected for the analysis.
- If the Nearest Neighbor Details analysis is selected, select a file using the Save As dialog box. The report can then be viewed in a spreadsheet or text program.
- The report is a tab-delimited text file (*.txt) that can be opened in Microsoft Excel or other spreadsheet programs for further analysis.
You can also export marker coordinates directly from Neurolucida, Neurolucida 360, or Vesselucida 360 via the Export Marker Coordinates tool.
Whereas other reports describe the marker size as a diameter, this report describes it as the radius (this is due to issues of compatibility with previous versions).
Average distance between markers: Reports the average distance between every pair of markers. Expect long computation times for images that contain more than a few thousand markers.