Contours
Purpose
|
Contours analysis can provide insight into the size and organization of regions in the tissue. The analyses include length, area, depth, perimeter, centroid, and other metrics for selected contours. |
Analysis results
Contour summary: Provides the total number of contours selected for analysis along with length and area metrics.
Contours are distinguished by their name and are grouped according to two basic types: Closed contour (closed loop that encloses a region) and open contour (contour with length, but not area).
-
Open: Total number of open contours.
-
Closed: Total number of closed contours.
-
Total Length (µm): Sum of the lengths of all contours of each type.
-
Length of a closed contour (µm): Perimeter around the contour.
-
Length of an open contour (µm): Distance from one end of the contour to the other end.
-
Mean Length (µm): (Total length) / (Number of contours - open and closed).
-
Total Area (µm²): Sum of the areas of all of the closed contours.
-
Mean area (µm²): (Total area) / (Number of closed contours).
In the absence of closed contours for a given type of contour, the total area and mean area are marked "n/a" (i.e., not applicable).
Contour details: Provides length, area, depth, perimeter, centroid, and other metrics for each selected contour.
-
Depth (µm): The Z coordinate of the first point of the contour.
-
Perimeter (µm): The length of a closed contour.
-
Area (µm²) : The area of a closed contour.
-
Centroid: The XYZ coordinates of the centroid. Centroids are defined for closed contours (open contours display "n/a"). The centroid is the point where the contour balances. Suppose that a pencil point were placed at the centroid. The contour would balance on the pencil point.
-
Feret Max (µm): Only defined for closed contours. Feret maximum refers to the largest dimension of a contour as if a caliper were used for measurement. Feret maximum and Feret minimum measurements are independent of one another and not necessarily at right angles to each other. Somas detected automatically in the Neurolucida 360 3D environment are contoured in X-Y at each z-plane in which the cell appears; typically multiple contours will be reported for each soma. Feret maximum is reported for each contour drawn.
-
Feret Max Start: The starting XYZ coordinates of the Feret maximum line are determined by moving in a counter clockwise direction from the bottom right most point of the contour until one end of the Feret maximum line is encountered. This is designated as the start of the Feret maximum line.
-
Feret Max Angle (°): The angle between the X axis and Feret maximum line measured in a counter clockwise direction.
-
Feret Min (µm): Only defined for closed contours. Feret minimum refers to the smallest dimension of a contour as if a caliper were used for measurement. Feret minimum and Feret maximum measurements are independent of one another and not necessarily at right angles to each other. Somas detected automatically in the Neurolucida 360 3D environment are contoured in X-Y at each z-plane in which the cell appears; typically multiple contours will be reported for each soma. Feret minimum is reported for each contour drawn.
-
Feret Min Start: The starting XYZ coordinates of the Feret minimum line are determined by moving in a counter clockwise direction from the bottom right most point of the contour until one end of the Feret minimum line is encountered. This is designated as the start of the Feret minimum line.
-
Feret Min Angle (°): The angle between the X axis and Feret minimum line measured in a counter clockwise direction.
-
Aspect ratio:
The degree of flatness of a contour shape as the ratio of its minimum diameter to its maximum diameter.
- Range of values is 0-1.
- A circle has an aspect ratio of 1.
- Remember that aspect ratio describes the 2-dimensional contour, and may not describe the 3-dimensional shape of particles being observed.

-
Compactness:
Describes the relationship between the area and the maximum diameter.
- The range of values is 0 to 1.
- A circle is the most compact shape (compactness for a circle = 1).
- A square has a compactness of 0.8.

-
Convexity:
A completely convex object does not have indentations, and has a convexity value of 1 (e.g., circles, ellipses, and squares).
- Concave objects have convexity values less than 1.
- Contours with low convexity have a large boundary between inside and outside areas.

-
Form Factor:
The form factor differs from the compactness by considering the complexity of the perimeter of the object. For example, a circle with a smooth perimeter has a compactness of 1 and a form factor of 1. If the smooth perimeter is replaced with a finely jagged edge (like a cell covered in microvilli), the compactness is still near 1, but the form factor is much smaller since the perimeter is lengthened considerably.
-
As the contour shape approaches that of a perfect circle, this value approaches a maximum of 1.0.
-
As the contour shape flattens out, this value approaches 0.

-
-
Roundness:
Roundness is the square of the compactness. By squaring the value, it is easier to differentiate objects that have small compactness values.
- Ranges from 0 to 1.

-
Solidity:
Solidity is the area of the contour divided by the convex area.
The area enclosed by a ‘rubber band’ stretched around a contour is called the convex area.
- Circles, squares, and ellipses have a solidity of 1.
- Indentations in the contour take area away from the convex area, decreasing the actual area within the contour.
Note that it is possible to have contours with low convexity and high solidity, and vice versa.

-
Average Line Thickness (µm): The average thickness of the contour if thickness is turned on and adjusted while tracing the contour.
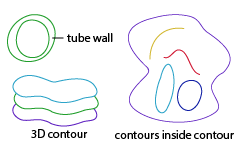
3D contour summary: Calculates the volume and surface area of sets of contours of a single type based on the contours' areas, thickness, and interval lengths.
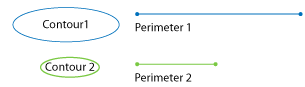
Surface = [(perimeter Contour 1 + perimeter Contour 2 + ... + perimeter Contour n)/n] * thickness
Contours in Closed Contours: Provides a summary of the number of contours of each type that are contained within the bounds of each of the other contours when all contours and markers are projected into a single X-Y plane. Z information is not taken into account in this analysis.
To analyze a single section, use the Section tab in the Traced structures panel.
Tube wall analysis: Provides an analysis of tubes created when one closed contour lies entirely within the bounds of another closed contour.
Tubes of a given type are defined by the outer and inner contours. Contours of a single type are grouped together in this analysis.
Z information is not taken into account in this analysis; as a result, volume of the tube wall is not provided. In addition, tracings from different Z depths are flattened into a single X-Y plane, so care must be taken in selecting only contours that are in the same Z region.
The following is included in this report:
-
Outer Contour: Contour type (i.e., the contour or structure selected to create the tracing).
-
Outer Contour Centroid: Position (coordinates) of the outer contour centroid.
-
Inner Contour: Contour type (i.e., the contour or structure selected to create the tracing).
-
Inner Contour Centroid: Position (coordinates) of the inner contour centroid.
-
Average thickness (µm²): Average tube thickness.
-
Outer Area (µm²): Area of the outer contour.
-
Inner Area (µm²): Area of the inner contour.
-
Tube Wall Area (µm): Area of the outer contour minus the area of the inner contour.
-
Outer Perimeter (µm): Length of the outer contour.
-
Inner Perimeter (µm): Length of the inner contour.
-
G-Ratio: Distance of centroid coordinate of inner contour to inner contour ÷ distance of centroid coordinate of inner contour to outer contour.