3-D Wedge analysis
Purpose
Use 3-D wedge analysis to understand the distribution of dendrites around the center of a cell body. The analysis is designed to show, in detail, the distribution of processes extending from the centroid of a cell body in several directions.
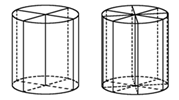
To do this, Neurolucida Explorer draws a cylinder that completely encompasses your neuron, with its center axis running through the cell-body centroid; you choose whether the center axis is parallel to the X, Y, or Z-axis (step 3.a below). Next, that main analysis cylinder is divided into smaller sections (bins), consisting of parallel planes, smaller cylinders, and angular wedges. You choose the size or number of each of those types of spatial bin types (step 3.b).
Before You Start
- Open the data file.
-
Select a cell body and associated processes for the analysis.
Note that if more than one soma, cell body, or closed contour is selected for the analysis, the center of the bounds of those structures is used as the cell-body centroid.
Procedure
-
 Select 3-D Wedge Analysis from the Spatial drop-down menu on the Analyze ribbon.
 - From the 3-D Wedge Analysis window that opens, select the type(s) of branch structures to analyze and click Display.
-
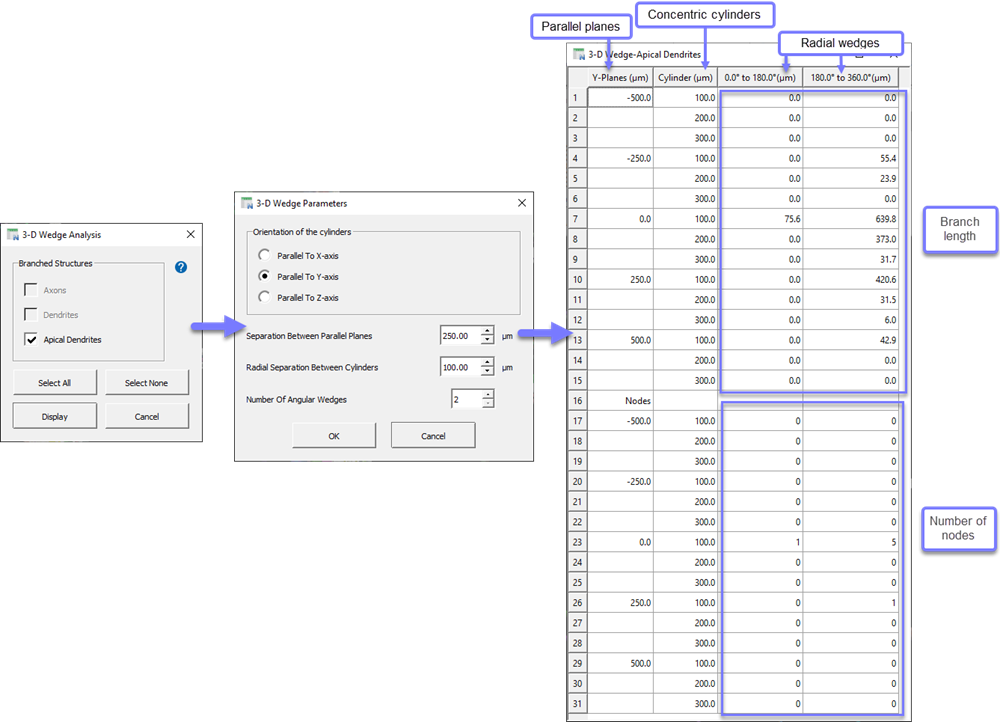
In the 3-D Wedge Parameters window that opens:
-
Select the orientation of the cylinders to be used in the analysis. This determines the orientation of the main analysis cylinder.
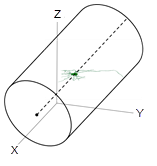
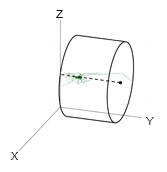
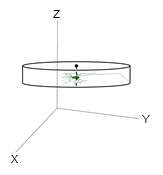
Parallel to X-axis Parallel to Y-axis Parallel to Z-axis -
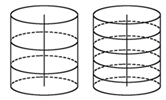
Define the spatial bins you want to use for the analysis in each orientation:
Few compared to many spatial bins Separation Between Parallel Planes—Analyze your neuron's distribution by slicing the main cylinder with parallel planes. Parallel planes run perpendicular to the axis selected for the main cylinder orientation in the previous step.
Choose multiple bins in this orientation by setting a relatively short distance or set a longer distance to define larger bins.
Radial Separation Between Cylinders—You can include multiple analysis-cylinders concentrically placed around the selected axis inside the main analysis cylinder. The radial separation is the increase in radius from one cylinder to the one that surrounds it.
Choose a relatively short distance to include many cylindrical bins or choose a large distance to analyze fewer bins
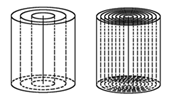
Number of Angular Wedges—The cylinders are divided into bins by dividing the 360 degrees of the cylinder into a set number of angular wedges. The wedges extend from the axis out to the greatest extent of the neuronal processes.
Choose a large number to create many wedge-shaped bins or a small number to define fewer large bins.
-
Click OK to run the analysis.
-
Analysis results
A data table is displayed for each branched structure selected in step 2 (see image below). In each table, the analysis is organized as follows:
- The top of the table shows the length of branches in each bin and the bottom half displays the number of nodes.
- X-, Y-, or Z-Planes (µm): the first column shows the parallel planes used in the analysis.
- Cylinder (µm): the second column lists cylindrical bins used.
-
Each column on the right shows one of the angular wedges used in the analysis.
-
The columns on the right show the angular wedges used in the analysis and the branch length and node-number data are displayed. Note that you will have one column for each angular wedge.
- Each column on the right shows the branch length and node-number data for one of the angular wedges used in the analysis.
Reference
Kawaguchi Y., Karube F., Kubota Y. (2006) Dendritic Branch Typing and Spine Expression Patterns in Cortical Nonpyramidal Cells. Cereb. Cortex 16(5): 696-711.