Analysis and Plotting window
There are five areas in the window 
- To view data specific to the open project, use the Analyze data step from one of the workflows OR click Analyze datafrom the View menu.
- To compare data sets from multiple projects, click the Group analysis button
 OR click Group analysis from the View menu.
WormLab software calculates default values for the range (min, max) and the bin width based on data from the selected track. You can modify these values to cover the range of values in multiple tracks so that you can create histograms with the same range and bin width across multiple tracks.
- Bin Width: The bins are the vertical columns in the histogram. They represent a fixed range of values over which the software counts the number of data points that fall within the bin range.
- Range: The range of values considered in the histogram. The number of bins is the range divided by the bin width.
For each histogram, you can modify the following:
- Track ID: Select a track to display the data associated with that track.
- Bin Width: Modify the bin width to compare data across tracks easily.
- Range: Modify the minimum and/or maximum measurements to include in the histogram.
Click Refresh Data after modifying values to update the display for both the data in the table and the histogram.
Speed to label center, including the Moving Average and Smoothed Speeds to label center
 When you open an existing project or use Analyze Data for a large data set, loading may be slower.
After tracking, WormLab displays the data in the Data tab in the Data Analysis and Plotting window.
See Export data with Copy or Export for details on exporting data.
WormLab automatically generates plots.
- To zoom in and out of the plot, use the mouse wheel.
- To pan, press the left mouse button and drag the plot.
- To view the entire plot, click Center Plot.
By default, WormLab creates plots representing data for all the tracks.
- To create a snapshot of the plot and paste it into a different program (word processing, slide presentation), click Copy Plot.
- To create an image file for the plot (pdf ,png, jpg, bmp), click Save Plot.
The information and choices displayed here depend on which analysis is selected. You can modify parameters for each type of analysis.
- Kalman Smoothing: Check the Kalman Smoothing checkbox to optimize speed calculations by minimizing the effects of midpoint shifts in the worm-movement model fit.
- Export Selected: This button facilitates the export of multiple analyses with a single click.
- Select the analyses you want to export from the list by holding Ctrl or Shift on your keyboard and clicking with your mouse.
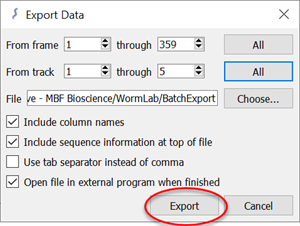
- Click the Export Selected button and the Export Data window will open.

- Choose frames, tracks, file-storage location, and export-format options, then click export to save .csv files of the selected analyses.


