Analysis and Plotting window
There are four areas in the window 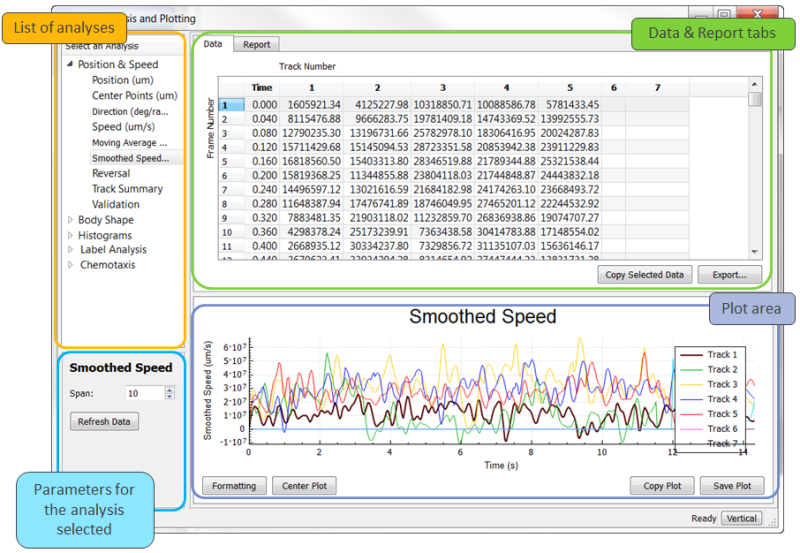
- To view data specific to the open project, use the Analyze data step from one of the workflows OR click Analyze datafrom the View menu.
- To compare data sets from multiple projects, click the Group analysis button
 OR click Group analysis from the View menu.
The software provides default values for the range (min,max) and the bin width based on the track data. You can modify these values to cover the range of values over multiple tracks. This allows you to create multiple histograms of the same range and bin width across multiple tracks. 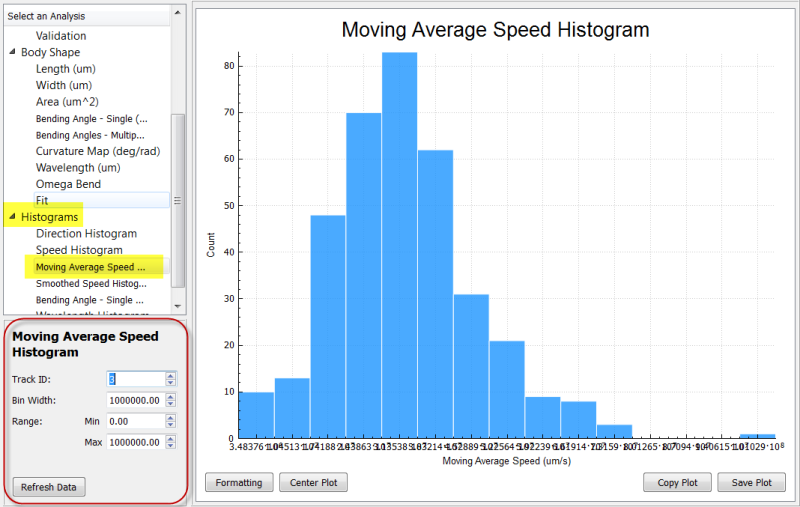
- Bin Width: The bins are the vertical columns in the histogram. They represent some fixed range of value over which the software counts the number of data points that fall within the bin range.
- Measurement Range: The range of values considered in the histogram. The number of bins is the range divided by the bin width.
For each histogram, you can:
- Select a track to display the data associated with that track (Track ID).
- Modify the bin width (Bin Width) to compare data easily.
- Modify the measurements' range (Range).
Click Refresh Data upon modifying values to update the display for both the data in the table and the histogram.
 When you open an existing project or use Analyze Data for a large data set, loading may be slower.
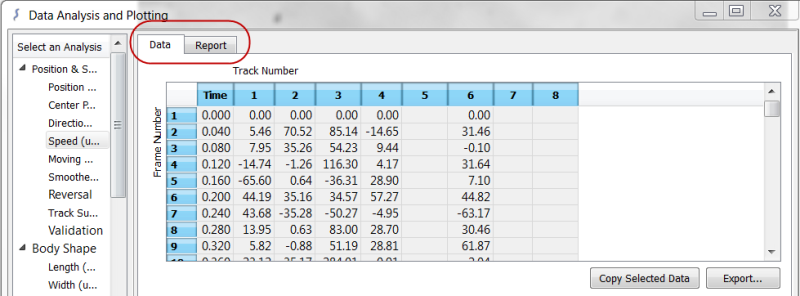
After tracking, WormLab displays the data in the Data tab in the Data Analysis and Plotting window.
See Export data with Copy or Export for details on exporting data.
WormLab automatically generates plots.
- To zoom in and out of the plot, use the mouse wheel.
- To pan, press the left mouse button and drag the plot.
- To view the entire plot, click Center Plot.
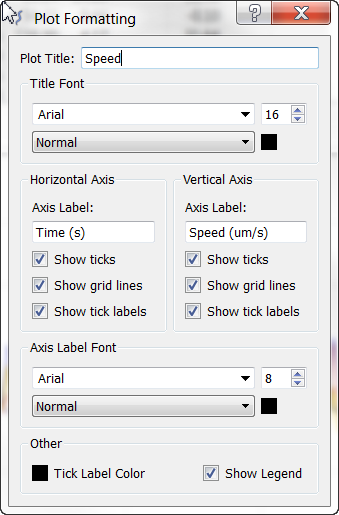
- To format plot elements such as title and axes, click the Formatting button
 .
. - To format a data line/bar, double-click the line/bar
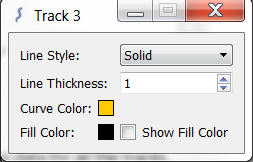 .
.
Format modifications are applied to the plots you view after the plot that was re-formatted.
By default, WormLab creates plots representing data for all the tracks.
- To view data for a single track, click the track number in the data table.
- To compare data for several tracks, click one track number then hold down the CTRL key while you select additional track numbers in the data table.
- To view data for all tracks, click the top left corner of the Data table.

- To create a snapshot of the plot and paste it into a different program (word processing, slide presentation), click Copy Plot.
- To create an image file for the plot (pdf ,png, jpg, bmp), click Save Plot.
You can modify parameters for each type of analysis.