Contours

Contours analyses are included in the Markers and Region analyses which provide insights into the distribution of cells and the size and organizations of regions in the tissue.
Provides the total number of contours selected for analysis.
Contours are distinguished by their name and are grouped according to two basic types: Closed contour (closed loop that encloses a region) and open contour (contour with length, but not area).
- Open: Total number of open contours
- Closed: Total number of closed contours
- Total Length (µm): Sum of the lengths of all contours of each type.
- Length of a closed contour: Perimeter around the contour.
- Length of an open contour: Distance from one end of the contour to the other end.
- Mean Length (µm): (Total length) / (Number of contours - open and closed)
- Total Area (µm2): Sum of the areas of all of the closed contours.
- Mean area (µm2): (Total area) / (Number of closed contours)
In the absence of closed contours for a given type of contour, the total area and mean area are marked "n/a" (i.e., not applicable).
- Depth (µm): Average Z position of the contour. The average Z is the mean of the Z coordinates for all points in the contour.
- Perimeter (µm): Length of a closed contour
- Area (µm2): Contour area
- Centroid: Only defined for closed contours (open contours display "n/a"). The centroid is the point where the contour balances. Suppose that a pencil point were placed at the centroid. The contour would balance on the pencil point.
- Feret Max and Feret Min: Only defined for closed contours. Feret maximum and Feret minimum refer to the largest and smallest dimensions of a contour, respectively, as if a caliper were used for measurement. The two measurements are independent of one another and not necessarily at right angles to each other. Somas detected automatically in the Neurolucida 360 3D environment are contoured in X-Y at each z-plane in which the cell appears; typically multiple contours will be reported for each soma. Feret maximum and Feret minimum are reported for each contour drawn.
- Aspect ratio: Feret Max ÷ Feret Min. The minimum aspect ratio is 1; a circle has an aspect ratio of 1; a square has an aspect ratio of approximately 1.4.
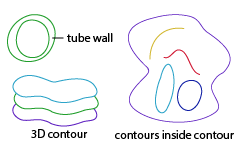
Provides a summary of the number of contours of each type that are contained within the bounds of each of the other contours when all contours and markers are projected into a single X-Y plane. Z information is not taken into account in this analysis.
- To analyze a single section, use the Section tab in the Traced structures panel.
Provides an analysis of tubes created when one closed contour lies entirely within the bounds of another closed contour.
Tubes of a given type are defined by the outer and inner contours. Contours of a single type are grouped together in this analysis.
Z information is not taken into account in this analysis; as a result, volume of the tube wall is not provided. In addition, tracings from different Z depths are flattened into a single X-Y plane, so care must be taken in selecting only contours that are in the same Z region.
The following is included in this report:
- Outer Contour: Contour type (i.e., the contour or structure selected to create the tracing)
- Outer Contour Centroid: position (coordinates) of the outer contour centroid
- Inner Contour: Contour type (i.e., the contour or structure selected to create the tracing)
- Inner Contour Centroid: position (coordinates) of the inner contour centroid
- Average thickness: Average tube thickness
- Outer Area: Area of the tube exterior
- Inner Area: Area of the tube interior
- Tube Wall Area
- Outer Perimeter
- G-Ratio: distance of centroid coordinate of inner contour to inner contour ÷ distance of centroid coordinate of inner contour to outer contour
