Setting up a focus map for slide scanning
Once the scanning settings are defined, you are ready to create a focus map. Follow the procedure below then scan and compile the virtual slide.
If you don't need a focus map and the entire scan can be done at the current Z -depth, right-click and select Start scanning slide.
To terminate the focus map setup and return to the tracing window, right-click and select Exit without scanning.
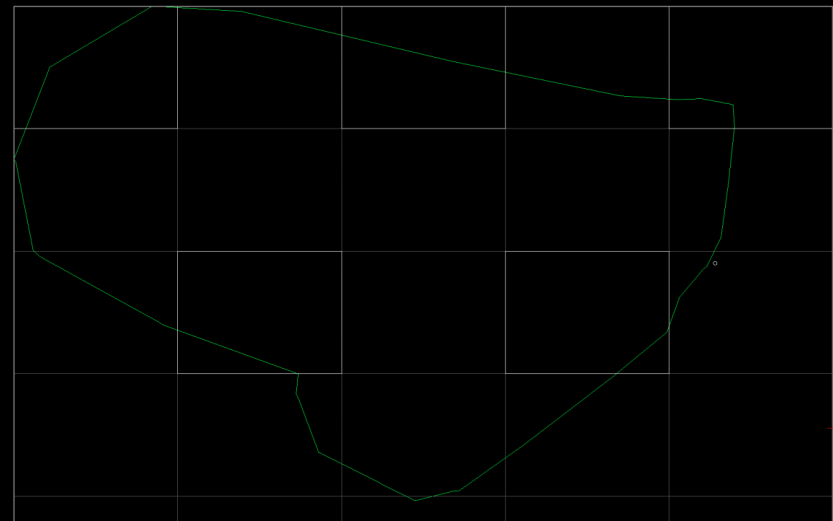
- Once the file name and location have been specified, the contour appears inside a grid.
If no grid is visible, click in the contour to display the grid; if clicking the contour doesn't work, right-click within the tracing window and verify that Show All Scan Sites is checked.
 Multiple contours
- For multiple contours, click the contour of interest to create a focus map for that contour.
- To select multiple contours, click each of them.
- The selection order determines order and naming for acquisition. The contour you clicked first is acquired first and its file name is base name-1, the contour you clicked second is then acquired and its file name is base name-2, and so on.
- Create a focus map for each region of interest to be scanned using one of three methods:
- Hold down the Shift key and click several sites to create a triangulation pattern between the selected sites.

- Right-click and select Random focus sites.
- Right-click and select Use markers to select sites.
If the tissue is particularly wavy or uneven, use more sites for a better quality image.
- Hold down the Shift key and click several sites to create a triangulation pattern between the selected sites.
- To remove a selected site from the focus map, click it.
- Once all the focus sites (i.e., grid cells) have been selected, right-click and select Focus at selected sites.
- The stage navigates to each selected site and the Focus Site dialog box opens. Bring the site into focus and click OK .
- To skip the current site, click Skip this site; that focus site will be removed from the focus map.
- To exit the focus map, click Cancel.
- For Device Control options, click More.
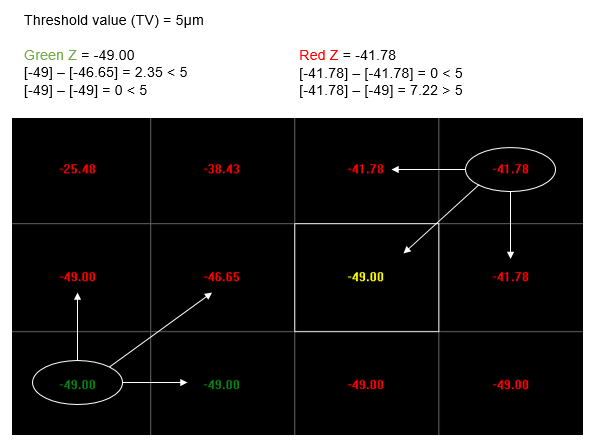
- When all the focus sites have been set, the focus grid is displayed with a colored interpolated focus map.

- Yellow represents the focus sites selected at Step 2.
- Green represents Z where the difference between Green Z and Z from each adjacent site is less than the threshold value you defined.
- Red represents Z where the difference between Red Z and at least one adjacent site is equal or greater than the threshold value.
- To add focus sites, hover the mouse over the desired grid cell, right-click, and select Add to focus site list. Bring the tissue into focus and click OK.
- Once the focus map is satisfactory, right-click and select Start scanning slide with pre-focus. The acquisition process begins.