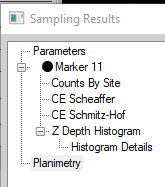
View the sampling results
Optical Fractionator - step 11
Procedure
- Click a set in the Probe Runs list to select it then click the View Results button OR click Display Probe Run List (use after running more than one probe if you want results from multiple probe runs).
- The Previous Stereological Runs dialog box opens. Highlight all the Probe runs you want results for in the list.
- Click View Results.
See Probe Run List for a general description of the parameters displayed in the Sampling Results window and the Excel worksheet (if you elected to export the results to Excel).
Interpretation
The program provides four estimates. The results vary based on the measurement used for the mounted (or post-processing) section thickness. The mounted section thickness value is divided into the counting frame thickness (or disector height) to calculate the height sampling fraction (hsf). We recommend that you report the estimate that best reflects the histological properties of the region of interest.
Calculated using a single value entered manually for the post-processed or “mounted” section thickness.
Because this estimate is generated with only one value for the section thickness, local variations in section thickness are not accounted for. As a result, this estimate should be considered the least accurate of the 4 available estimates. But if there is no section thickness variation (e.g., embedding protocols such as plastic embedding), reporting the Estimated population using user-defined section thickness is acceptable.
This value is typically entered manually, or calculated, in Step 5 of the Optical Fractionator workflow under the Manually enter the average mounted thickness method.
- If you don't enter a value for Manually enter the average mounted thickness, the estimate equals zero.
- To change the thickness value after the counting procedure, click the Edit Mounted Thickness button in the Sampling results window.
Calculated using the section thickness measurements recorded while counting.
These measurements are recorded in Step 5 of the Optical Fractionator workflow, after selecting Measure the mounted thickness while counting method.
The number of measurements used to calculate this estimate is based on the interval you entered (e.g., if you entered 2, you are prompted to set the top and bottom of the section at every other counting site). The measured thickness values from these sites are averaged to produce a mean measured thickness value used for the height sampling fraction calculation.
Because this estimate is generated from the mean of all obtained section thickness measurements, it is considered to be the most accurate estimate of the region of interest when measurements are not performed at every site.
You may also choose to use this value for low frequency events (e.g., Brdu+ neurons) with many counting sites containing zero objects when you want to generate an accurate average measured section thickness measurement for the hsf using a systematic interval for site measurement.
If you didn't measure the thickness of sections while counting, this estimate is not calculated.
This estimate is a variation of Estimated population using mean section thickness.
Calculated using only the section thickness measurements made at counting sites that contain marked objects (in other words, section thickness measurements from counting sites with NO counted objects aren't included in the calculated average).
These measurements are recorded in Step 5 of the Optical Fractionator workflow, after selecting Measure the mounted thickness while counting method.
In many cases, this estimate will be nearly identical to Estimated population using mean section thickness.
You may choose to use this value when :
- You chose to ignore measuring the section thickness where there were no objects.
- You made errors in section thickness measurement that were not corrected when there were no objects to be marked.
If you didn't measure the thickness of sections while counting, this estimate is not calculated.
Report this estimate when thickness was measured at every sampling site and when the section thickness varies dramatically across the sections that include the region of interest.
Calculated using only the section thickness measurements from counting sites that contain markers. These measured thickness values are then weighted by the number of objects associated with them to produce a weighted average.
The number weighted mean section thickness is reported in the Parameters section and is used to calculate the height sampling fraction.
All estimates calculated from measurements obtained while counting (i.e., all but Estimated population using user-defined section thickness) should return similar results if the measurements were taken correctly.
| Result name | Description |
| Marker X | Typically, each marker represents one cell type. |
| Counts by Site | Raw data for each counting frame visited in each of the runs. |
| CE Scheaffer | See Coefficients of Error |
| CE Schmitz-Hof | |
| Z Depth Histogram | Z depth location for markers placed in each section. |
| Planimetry | How area and volume are calculated based on the area contained within the traced contour. NOT an unbiased estimate. |
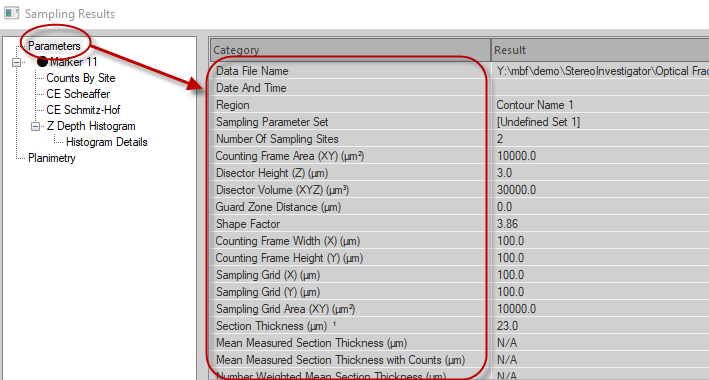
| Data File Name | File name associated with this data set, if the data was already saved. |
| Date and Time | When the probe was completed. |
| Region | Name of the contour type that defines the region of interest. If this is a composite of several runs, displays the contour name used for the first run is shown. |
| Number of Sampling Sites | Number of sampling sites visited on all selected sections. |
| Counting Frame Area | Area of a single counting frame. |
| Counting Frame Thickness | Thickness of the counting frames along the Z-axis. |
| Counting Frame Volume | Volume of a single counting frame. |
| Counting Frame Width | X-axis width of each counting frame. |
| Counting Frame Height | Y-axis height of each counting frame. |
| Sampling Grid Width | Distance between counting frames (sampling sites) along the X-axis. |
| Sampling Grid Height | Distance between counting frames (sampling sites) along the Y-axis. |
| Sampling Grid Area | Area of the region associated with each sampling step. |
| Section Thickness | Value used for section thickness across all sections that were sampled. This should be the minimum actual section thickness as measured by Stereo Investigator. |
| Number Weighted Mean Section Thickness | Mean of all sections measured by focusing at the top and bottom of the section. This value should be relatively close to the Section Thickness value. |
| Estimated Population using Number Weighted Section Thickness | Report this estimate when thickness was measured at every sampling site and when the section thickness varies dramatically across the sections that include the region of interest. Calculated using only the section thickness measurements from counting sites that contain markers. These measured thickness values are then weighted by the number of objects associated with them to produce a weighted average. The number weighted mean section thickness is reported in the Parameters section and is used to calculate the height sampling fraction. |
| Total Markers Counted | Actual number of markers of this type counted during the probe run. |
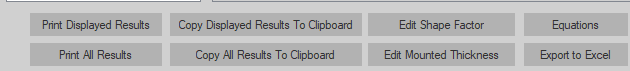
| Print All Results | Prints all the results for the selected probe run. |
| Copy All Results to the Clipboard | Copies all the selected probe run results to the Windows Clipboard. |
| Edit Shape Factor | Displays the Shape Factor dialog box (see sShape Factor). To obtain as accurate an estimate of the Coefficient of Error as possible, use the slider to edit the Shape Factor which describes the shape of the region of interest. |
| Edit Mounted Thickness | Use to adjust the section thickness. |
| Equations | Displays the equations used for the probe run. |
| Summary tab | Estimates and CEs for each individual marker. |
| Parameters tab | Information to be added to the Methods section of a publication to enable other researchers to test the reproducibility of the results. |
| Counts by Site tab | Information about the measured thickness and number of markers at each site. This information can be used to calculate your own CE or to compare thicknesses/number of cells within a section or between sections |
| Coefficient of Error tab | Several CEs. |
| CE Variance Details tab | Information related to the calculation of the Gundersen and Shaeffer CEs. |
| Section Details tab | Marker counts by section. |
| All Markers Z Histogram and Individual Markers Z Histogram tabs |
Distribution of cells within the tissue.
|
| Z Depth tab | Raw data necessary for your Z depth histogram. |
| Z Depth Details tab | Actual Z values for each marker (rather than markers per bin). |
| Smoothness tab | Distribution of markers within your ROI. |
| Planimetry tab |
Area of each section and volume calculated from this area. Note that this information is biased; for an unbiased estimate of area/volume, use the Cavalieri Estimator. |
| Z Order tab | Z value of the sections and the actual Z at which the contour were drawn in each section. |
| Raw Report tab | Number of markers and tissue thickness per site. |